This site uses cookies to improve your experience. To help us insure we adhere to various privacy regulations, please select your country/region of residence. If you do not select a country, we will assume you are from the United States. Select your Cookie Settings or view our Privacy Policy and Terms of Use.
Cookie Settings
Cookies and similar technologies are used on this website for proper function of the website, for tracking performance analytics and for marketing purposes. We and some of our third-party providers may use cookie data for various purposes. Please review the cookie settings below and choose your preference.
Used for the proper function of the website
Used for monitoring website traffic and interactions
Cookie Settings
Cookies and similar technologies are used on this website for proper function of the website, for tracking performance analytics and for marketing purposes. We and some of our third-party providers may use cookie data for various purposes. Please review the cookie settings below and choose your preference.
Strictly Necessary: Used for the proper function of the website
Performance/Analytics: Used for monitoring website traffic and interactions
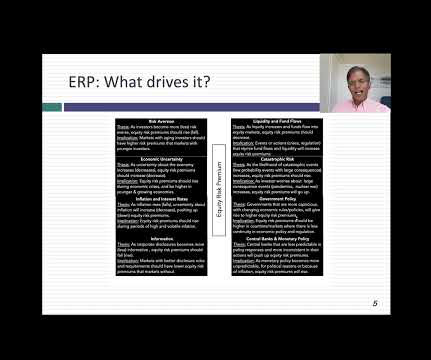
If you have been reading my posts, you know that I have an obsession with equity riskpremiums, which I believe lie at the center of almost every substantive debate in markets and investing. That said, I don't blame you, if are confused not only about how I estimate this premium, but what it measures.
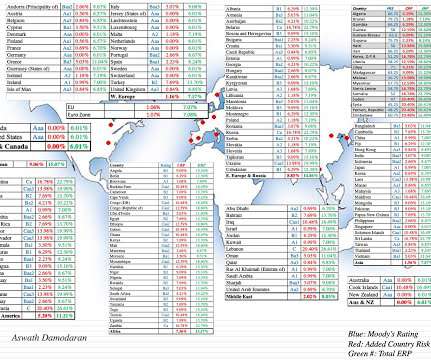
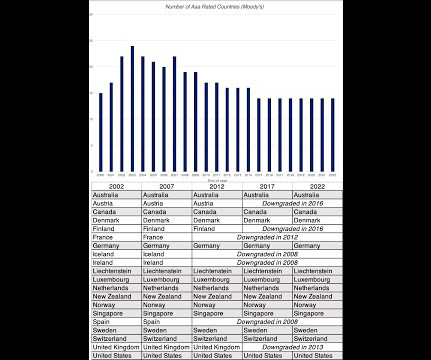
It has been my practice for the last two decades to take a detailed look at how risk varies across countries, once at the start of the year and once mid-year. Country Risk: Default Risk and Ratings For investors, the most direct measures of country risk come from measures of their capacity to default on their borrowings.
I will follow up by looking at the mechanics that connect stock prices to inflation, and examine why the damage from higher inflation can vary across companies and sectors. The Year in Review At the start of 2022, the S&P 500 was at 4766.18, up from 3756.07 at the start of that year. Stocks: The What?
Investors all talk about risk, but there seems to be little consensus on what it is, how it should be measured, and how it plays out in the short and long term. In closing, I will talk about some of the more dangerous delusions that undercut good risk taking. What is risk?
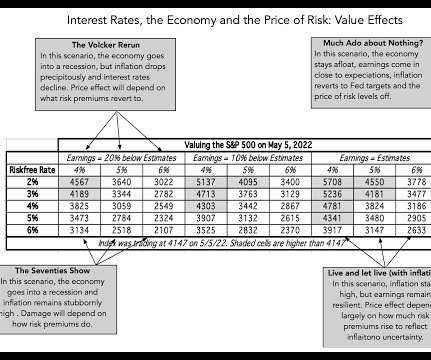
In most time periods, those recalibrations and resets tend to be small and in both directions, resulting in the ups and downs that pass for normal volatility. Clearly, we are not in one of those time periods, as markets approach bipolar territory, with big moves up and down.
By the same token, a country that is viewed as "first world" can lose that status, if people start perceiving the system as unfair, legal systems filled with delay and waster and a government that becomes capricious in its actions, or worse.
In my early 2021 posts on inflation, I argued that while the higher inflation that we were just starting to see could be explained by COVID and supply chain issues, prudence on the part of policy makers required that it be taken as a long term threat and dealt with quickly. in the NY Fed survey. in the NY Fed survey.
We started the year with significant uncertainty about whether the surge in inflation seen in 2022 would persist as well as about whether the economy was headed into a recession. The NASDAQ also gave back gains in the third quarter, but is up 27.27% for the year, but those gaudy numbers obscure a sobering reality.
At the start of the year, the consensus of market experts was that this would be a difficult year for markets, given the macro worries about inflation and an impending recession, and adding in the fear of the Fed raising rates to this mix made bullishness a rare commodity on Wall Street.
While stocks had their ups and downs during the year, they ended the year strong, and recouped, at least in the aggregate, most of the losses from 2022. Stocks ended the year well, with November and December both delivering strong up movements, and while this left investors feeling good about the year, it was a rocky year.
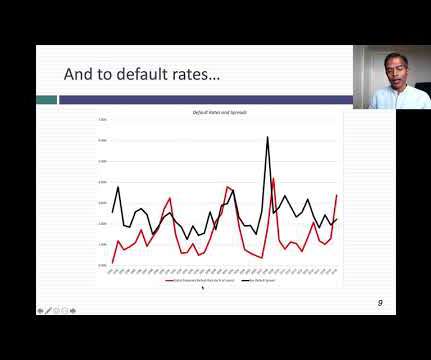
Just as rising equity riskpremiums push up the cost of equity, rising default spreads push up the cost of debt of companies, with the added complication of higher default risk for those companies that had pushed to the limits of their borrowing capacity in a low interest-rate environment.
In this post, I offer an alternative, albeit a more complicated, metric that I believe offers not only a more comprehensive measure of pricing, but also operates as a barometer of the ups and downs in the market. Note that nothing that I have said so far is premised on modern portfolio theory, or any academic view of riskpremiums.
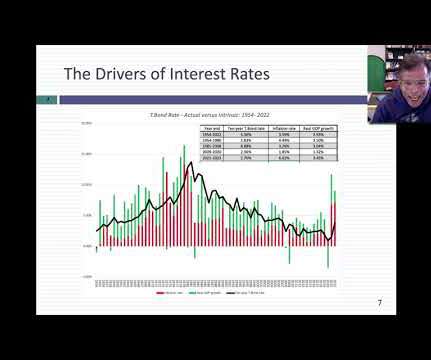
I took this estimation process for granted until 2008, when during that crisis, I woke up to the realization that no matter what the text books say about risk-free investments, there are times when finding an investment with a guaranteed return can become an impossible task. and the reverse will occur, when risk-free rates drop.
First, these categorizations were created close to twenty years ago, when I first started looking a global data, and many countries that were emerging markets then have developed into more mature markets now. Beta & Risk 1. Equity RiskPremiums 2. Return on Equity 1. Debt Ratios & Fundamentals 1. Debt Details 1.
Get started today by scheduling your free consultation below! It can also speed up the legal process, helping both parties understand the business’s fair market value. At Peak , these factors help us determine the company-specific riskpremium. As such, it is beneficial for solving disputes and misunderstandings.
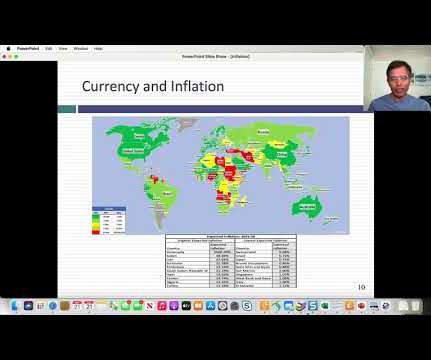
Inflation: Measurement and Determinants As the inflation debate was heating up in the middle of last year, I wrote a comprehensive post on how inflation is measured, what causes it and how it affects returns on different asset classes. Rather than repeat much of that post, let me summarize my key points.
In this post, I will start by looking at the role that hurdle rates play in running a business, with the consequences of setting them too high or too low, and then look at the fundamentals that should cause hurdle rates to vary across companies. US , Europe , Emerging Markets , Japan , Australia/NZ & Canada , Global ) 2.
So let's get started and discover the keys to accurate valuation! It's like a financial health check-up, examining everything from sales patterns to asset quality. A high M-Score could indicate higher risk, warranting a higher discount rate and thus a lower valuation.
As we start 2024, the interest rate prognosticators who misread the bond markets so badly in 2023 are back to making their 2024 forecasts, and they show no evidence of having learned any lessons from the last year. The Fed Effect: Where's the beef?
In my last post, I talked about the ritual that I go through every year ahead of my teaching each spring, and in this one, I will start on the first of a series of posts that I make at the start of each year, where I look at data, both macro and company-level. That is not true!
Thus, almost everything I know and practice, when valuing young and start-up companies, I learned in the process of valuing Amazon in the 1990s. Just as impressively, the company finally started delivering on its promise of profitability, going from barely making money in 2019 to an operating margin of 16.57% in 2022.
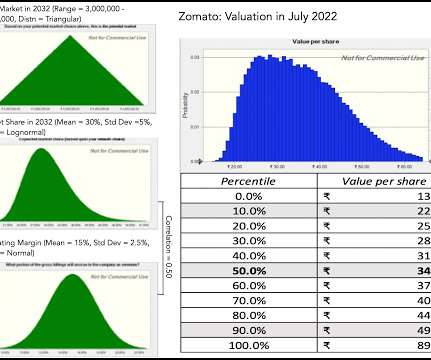
Zomato, an Indian online food-delivery company, was opened up to public market investors on July 14, 2021, and its market debut is being watched for clues by a number of other online ventures in India, waiting in the wings to go public. The Zomato IPO clocks in at 420 pages , much of it designed to bore readers into submission.
The second was that, starting mid-year in 2020, equity markets and the real economy moved in different directions, with the former rising on the expectations a post-virus future, and the latter languishing, as most of the world continued to operate with significant constraints.
With limited features and formulas, it can be difficult to account for all the necessary parameters in a valuation, such as interest rates, equity riskpremiums, and beta. It lacks interest rates, equity riskpremiums, beta, and other important data. You can Sign up for free here.
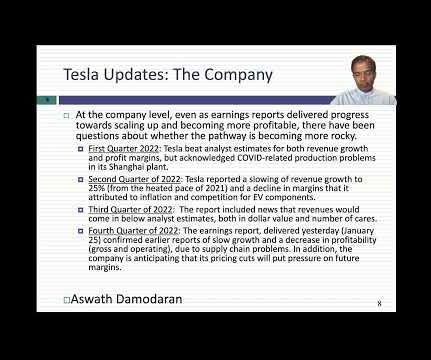
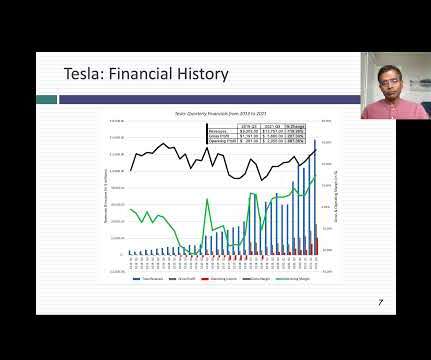
As I have valued Tesla over the years, I have come to the realization that it is the most 'uncar-like" automobile company in the world, and its uniqueness shows up on two dimensions. Put simply, the company has been able to scale up more quickly, while reinvesting less in capacity, than any other automobile company.
In my last three posts, I looked at the macro (equity riskpremiums, default spreads, risk free rates) and micro (company risk measures) that feed into the expected returns we demand on investments, and argued that these expected returns become hurdle rates for businesses, in the form of costs of equity and capital.
Looking at US equities, the S&P 500 is up about 11% and the NASDAQ about 5%, from start of the year levels, and the underperformance of the latter has led to a wave of stories about whether this is start of the long awaited comeback of value stocks, after a decade of lagging growth stocks.
To set the stage, I will start by laying out the differences measure of earnings that reported on an income statement: At the top of the profit ladder is gross income , the earnings left over after a company has covered the direct cost of producing whatever it sells.
When I started offering financial modeling training , I never expected to get questions about a methodology like the Dividend Discount Model (DDM). It can be useful for certain companies, such as power and utility firms and midstream (pipeline) operators in oil & gas … …but it’s also much harder to set up and use than a standard DCF.
The first of the is as companies scale up, there will be a point where they will hit a growth wall, and their growth will converge on the growth rate for the economy. In short, I am assuming that the price cuts and cost pressures of the fourth quarter are more representative of what Tesla will face in the future, as competition steps up.
I also start thinking about my passion, which is teaching, the spring semester to come, and the classes that I will be teaching, repeating a process that I have gone through every year since 1984, my first year as a teacher. Face up to uncertainty, rather than avoid or deny it : Uncertainty is a feature of investing/ business, not a bug.
In my last post , I described the wild ride that the price of risk took in 2020, with equity riskpremiums and default spreads initially sky rocketing, as the virus led to global economic shutdowns, and then just as abruptly dropping back to pre-crisis levels over the course of the year.
We note that the higher the expected rate (in other words, the greater the risk is perceived as necessary, to the point of requiring a substantial "riskpremium"), the lower the multiple that will apply and therefore the lower valuation: we buy cheaper which is less safe. 11% per year. 10% per year. around 1.5%). - Conclusion.
In a post at the start of 2021 , I argued that while stocks entered the year at elevated levels, especially on historic metrics (such as PE ratios), they were priced to deliver reasonable returns, relative to very low risk free rates (with the treasury bond rate at 0.93% at the start of 2021). The year that was.
Third, by making investing a choice between good (higher returns) and bad (higher risk), a message is sent, perhaps unwittingly, that risk is something to be avoided or hedged. micro uncertainties, into discount rates, and in the process, they end up incorporating risk that investors can eliminate, often at no cost.
The Lead In To understand the market effects of the Russia-Ukraine conflict, we need to start with an assessment of the two countries, and their places in the global political, economic and market landscape, leading in. Ukraine, a part of the Soviet Union, has had its shares of ups and downs, and its economic footprint is even smaller.
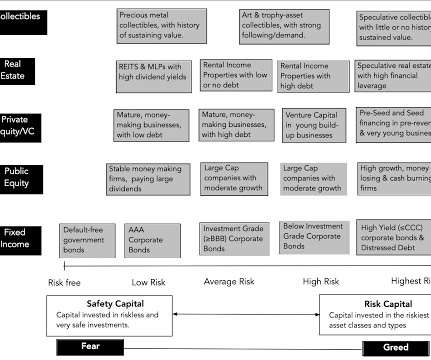
In this post, I will argue that almost everything that we are observing in markets, across asset classes, can be explained by a pull back on risk capital, and that understanding the magnitude of the pull back, and putting in historical perspective, is key to gauging what is coming next. Risk Capital: What is it?
In addition, the growth has come in fits and starts, and given Zomato's active acquisition strategy, it is not clear how much of the revenue growth is organic and how much is acquired. And no, you cannot add back stock based compensation and come up with an adjusted EBITDA to claim otherwise.)
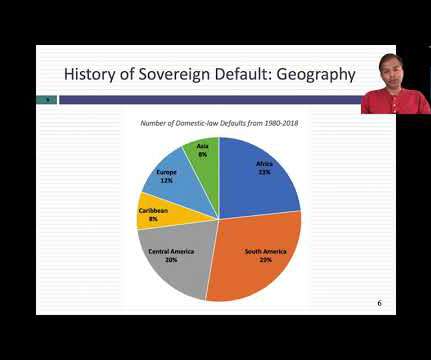
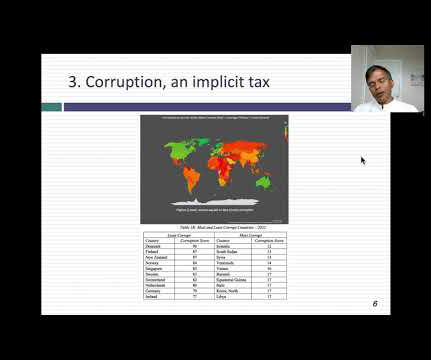
Since country risk is multidimensional and dynamic, my annual country risk update runs to more than a hundred (boring) pages , but I will try to summarize what the last year has brought in this post. Drivers of Country Risk What makes some countries riskier than others to operate a business in?
To start the year, I returned to a ritual that I have practiced for thirty years, and that is to take a look at not just market changes over the last year, but also to get measures of the financial standing and practices of companies around the world. Happy New Year, and I hope that 2022 brings you good tidings! Sometimes, less is more!
I have no particular insights to offer on physical risk, other than to note that while taking on physical risks for some has become a leisure activity, I have no desire to climb Mount Everest or jump out of an aircraft.
That judgment may be harsh, but as the Russian hostilities in Ukraine shake up markets, the weakest links in the ESG chain are being exposed, and as the same old rationalizations and excuses get rolled out, I believe that a moment of reckoning is arriving for the concept. They are hypothetical questions, but I think I know the answer.
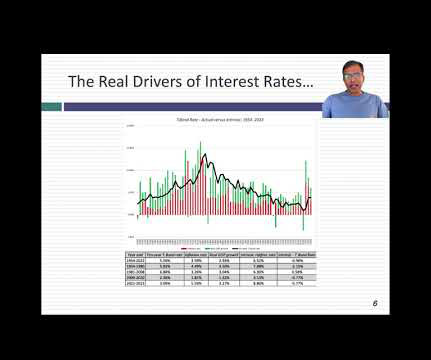
That may reflect the concern that once a person or entity starts borrowing to fund its needs, it is easy to overuse debt, and risk its wellbeing in the process. An Optimizing Tool In my second and third data posts for this year, I chronicled the effects of rising interest rates and riskpremiums on costs of equity and capital.
for the year are at war with its concurrent promise to keep rates low; after all, adding those numbers up yields a intrinsic risk free rate of 8.7%. While I understand that much of the real growth in 2021 is a bounce back from 2020, even using a 2-3% real growth yields risk free rates that are much, much higher than today's numbers.
We organize all of the trending information in your field so you don't have to. Join 8,000+ users and stay up to date on the latest articles your peers are reading.
You know about us, now we want to get to know you!
Let's personalize your content
Let's get even more personalized
We recognize your account from another site in our network, please click 'Send Email' below to continue with verifying your account and setting a password.


Let's personalize your content