This site uses cookies to improve your experience. To help us insure we adhere to various privacy regulations, please select your country/region of residence. If you do not select a country, we will assume you are from the United States. Select your Cookie Settings or view our Privacy Policy and Terms of Use.
Cookie Settings
Cookies and similar technologies are used on this website for proper function of the website, for tracking performance analytics and for marketing purposes. We and some of our third-party providers may use cookie data for various purposes. Please review the cookie settings below and choose your preference.
Used for the proper function of the website
Used for monitoring website traffic and interactions
Cookie Settings
Cookies and similar technologies are used on this website for proper function of the website, for tracking performance analytics and for marketing purposes. We and some of our third-party providers may use cookie data for various purposes. Please review the cookie settings below and choose your preference.
Strictly Necessary: Used for the proper function of the website
Performance/Analytics: Used for monitoring website traffic and interactions
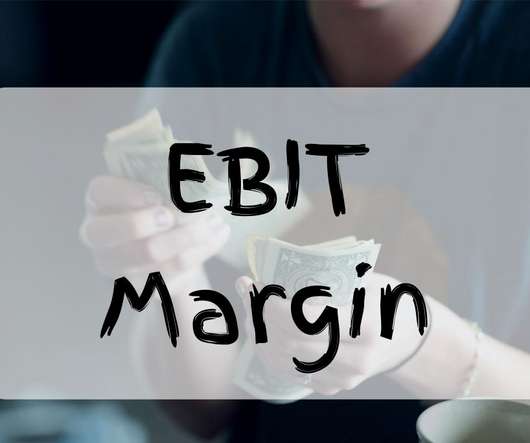
Definition of EBIT Margin. EBIT margin stands for Earning Before Interest and Tax margin. The higher the EBIT the better it is for the firm. What is the Formula for the EBIT Margin? EBIT margin is calculated by dividing EBIT by revenue. EBIT margin = EBIT / Revenue . EBIT Margin in Practice.
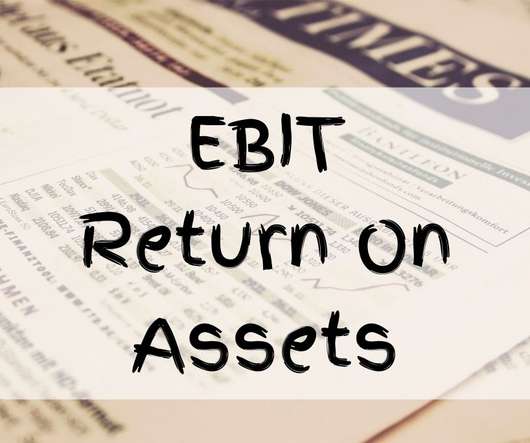
Definition of EBIT Return on Assets. EBIT return on asset measures the firm’s earnings before interest and tax with respect to the firm’s total asset. The reason EBIT is used and not net income is because EBIT focuses only on operating cash flows. . What is the Formula for EBIT Return on Assets? EBIT = Revenue ?
NOPAT can be calculated through the following formula: EBIT x (1 – tax rate). EBIT is the earnings before interest and tax. To find the ROIC, you divide NOPAT by Invested Capital. NOPAT ÷ Invested Capital. The NOPAT is the net operating profit after tax. ROIC in Practice. Tony wanted to open up a shop that sells shoes.
billion with EBIT margin increasing to 16.6% ABB’s five-year share price chart is shown below: Source: Yahoo Finance, [link]. The Trading Comparables analysis resulted in a valuation range of CHF 47 to 83 billion, by applying the observed trading multiples EV/EBITDA, EV/EBIT and P/E. ABB’s order intake rose 4% to CHF 7.9
billion with EBIT margin increasing to 16.6% ABB’s five-year share price chart is shown below: Source: Yahoo Finance, [link]. The Trading Comparables analysis resulted in a valuation range of CHF 47 to 83 billion, by applying the observed trading multiples EV/EBITDA, EV/EBIT and P/E. ABB’s order intake rose 4% to CHF 7.9
I have also developed a practice in the last decade of spending much of January exploring what the data tells us, and does not tell us, about the investing, financing and dividend choices that companies made during the most recent year. Financing Flows 5. EBIT & EBITDA multiple s 5. Aggregate operating numbers 3.
They give a vision of the company, which must be supplemented by other approaches to address the "true" price, which will result from the negotiation, i.e., the amount accepted by the assignor and financed by the buyer. . . Net Operating Surplus Multiples (ENE or EBIT). What multiples on results should be taken into account?
Visa’s five-year share price chart is shown below: Source: Yahoo Finance, [link] Valutico Analysis We analyzed Visa Inc. The Trading Comparables analysis resulted in a valuation range of $257 billion to $296 billion by applying the observed trading multiples EV/EBITDA, EV/EBIT and P/E.
Salesforce’s five-year share price chart is shown below: Source: Yahoo Finance, [link]. The Trading Comparables analysis resulted in a valuation range of $81 to $158 billion, by applying the observed trading multiples EV/EBITDA, EV/EBIT and P/E. Valutico Analysis. The Discounted Cash Flow analysis produced a value of $99.5
Salesforce’s five-year share price chart is shown below: Source: Yahoo Finance, [link]. The Trading Comparables analysis resulted in a valuation range of $81 to $158 billion, by applying the observed trading multiples EV/EBITDA, EV/EBIT and P/E. Valutico Analysis. The Discounted Cash Flow analysis produced a value of $99.5
Five-year share price chart is shown below: Source: Yahoo Finance, [link] Valutico Analysis We analyzed KHC by using the Discounted Cash Flow method, specifically our DCF WACC approach, as well as a Trading Comparables analysis. billion by applying the observed trading multiples EV/Sales, EV/EBITDA, EV/EBIT and P/E. billion to USD 74.5
Five-year share price chart is shown below: Source: Yahoo Finance, [link] Valutico Analysis We analyzed KHC by using the Discounted Cash Flow method, specifically our DCF WACC approach, as well as a Trading Comparables analysis. billion by applying the observed trading multiples EV/Sales, EV/EBITDA, EV/EBIT and P/E. billion to USD 74.5
LVMH’s five-year share price chart is shown below: Source: Yahoo Finance, [link] Valutico Analysis We analyzed LVMH Moët Hennessy – Louis Vuitton by using the Discounted Cash Flow method, specifically our DCF WACC approach, as well as a Trading Comparables analysis.
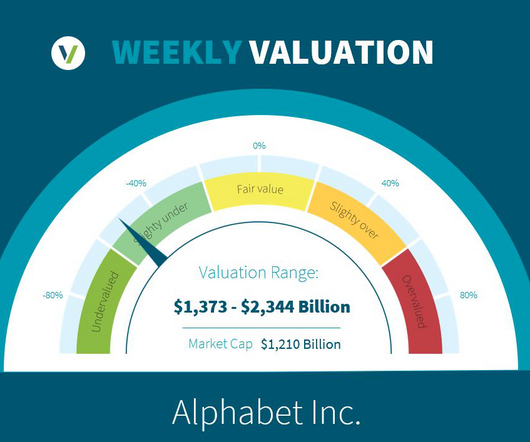
Alphabet’s five-year share price chart is shown below: Source: Yahoo Finance, [link] Valutico Analysis We analyzed Alphabet Inc. The Trading Comparables analysis resulted in a valuation range of $1,517 billion to $2,344 billion by applying the observed trading multiples EV/EBITDA, EV/EBIT and P/E.
Boeing’s five-year share price chart is shown below: Source: Yahoo Finance, [link] Valutico Analysis We analyzed The Boeing Company by using the Discounted Cash Flow method, specifically our Simplified DCF WACC approach, as well as a Trading Comparables analysis. The DCF analysis produced a value of $93.5 billion using a WACC of 8.8%.
Starbucks’ five-year share price chart is shown below: Source: Yahoo Finance, [link]. The Trading Comparables analysis resulted in a valuation range of $83 billion to $118 billion, by applying the observed trading multiples EV/EBITDA, EV/EBIT and P/E. Valutico Analysis. The Discounted Cash Flow analysis produced a value of $68.6
The Home Depot five-year share price chart is shown below: Source: Yahoo Finance, [link]. The Trading Comparables analysis resulted in a valuation range of $202 billion to $231 billion, by applying the observed trading multiples EV/EBITDA, EV/EBIT and P/E. Valutico Analysis.
During the Q1 conference call, the company emphasized how AI could boost productivity and reduce costs for enterprises and highlighted the company’s deployment of AI at scale in areas such as HR, finance, and end-to-end processes to speed up task completion and support margin expansion. billion, up 0.4% and up 4.4% at constant currency.
BP’s five-year share price chart is shown below: Source: Yahoo Finance, [link] Valutico Analysis We analyzed BP p.l.c. The Trading Comparables analysis resulted in a valuation range of GBP 98 (USD 199) billion to GBP 137 (USD 166) billion by applying the observed trading multiples EV/EBITDA, EV/EBIT, P/E and P/B.
Tencent’s five-year share price chart is shown below: Source: Yahoo Finance, [link]. billion to HKD 3,905 (USD 501) billion, by applying the observed trading multiples EV/EBITDA, EV/EBIT and P/E. Valutico Analysis. The Trading Comparables analysis resulted in a valuation range of HKD 1,752 (USD 221.5)
Anheuser-Busch’s five-year share price chart is shown below: Source: Yahoo Finance, [link]. The Trading Comparables analysis resulted in a valuation range of €98 to €222 billion, by applying the observed trading multiples EV/EBITDA, EV/EBIT and P/E. Valutico Analysis.
Tencent’s five-year share price chart is shown below: Source: Yahoo Finance, [link]. billion to HKD 3,905 (USD 501) billion, by applying the observed trading multiples EV/EBITDA, EV/EBIT and P/E. Valutico Analysis. The Trading Comparables analysis resulted in a valuation range of HKD 1,752 (USD 221.5)
Tencent’s five-year share price chart is shown below: Source: Yahoo Finance, [link]. billion to HKD 3,905 (USD 501) billion, by applying the observed trading multiples EV/EBITDA, EV/EBIT and P/E. Valutico Analysis. The Trading Comparables analysis resulted in a valuation range of HKD 1,752 (USD 221.5)
Anheuser-Busch’s five-year share price chart is shown below: Source: Yahoo Finance, [link]. The Trading Comparables analysis resulted in a valuation range of €98 to €222 billion, by applying the observed trading multiples EV/EBITDA, EV/EBIT and P/E. Valutico Analysis.
Check rules of thumb : Investing and corporate finance are full of rules of thumb, many of long standing. The second is that in my line of work, which is corporate finance and valuation, the numbers I need lie in micro or company-level data, not in the macro space. EV/EBIT and EV/EBITDA 4. Cost of Equity 1. PE & PEG 2.
Finally, many renewable energy debt deals take place within Project Finance teams at banks – but Project Finance and corporate finance are very different ! The same criteria as always apply: High grades, a good university or business school, previous finance internships, and a good amount of networking and interview prep.
This method is common in industries where valuations are commonly expressed as a multiple of Earnings Before Interest, Taxes, Depreciation, and Amortization (EBITDA) or Earnings Before Interest and Taxes (EBIT). A lower EV/EBIT ratio indicates a potentially better value for investors.
The Transaction provides diversification with no single end market contributing more than approximately a third of adjusted EBIT. The Transaction is fully funded by bank secured & vendor provided debt financing.
Introduction In the fiercely competitive landscape of finance, succeeding in a valuation interview requires a unique blend of knowledge, confidence, and strategic preparation. These interviews are not just a mere formality but a critical component of the hiring process in finance, investment banking, and consulting.
Second, the limitation on business net interest deduction is reduced to 30% of earnings before interest and taxes (EBIT) instead of earnings before interest, taxes, depreciation, and amortization (EBITDA). First, businesses are required to amortize research and development expenses over a five-year period.
In particular, IBP’s past performance revealed strong swings in annual EBIT and net earnings. The court then ruled that Hexion was obligated to consummate the acquisition, a transaction for which financing was no longer available. Thus, all considered, no MAE had occurred.
That is, were the companies in those transactions valued as a multiple of EBIT , EBITDA , revenue, or some other parameter? Debt-financed investors. With the comparable transactions method, you are looking for comparable metrics, usually multiples of earnings or revenue.
Valutico has once again made finance professional’s lives easier by announcing the launch of the Venture Capital (VC) method for valuing start-ups, available for the first time within its online platform. . Announcement: Valutico Provides an Easier Way to Value Startups. For demonstrations please contact Head of Marketing, Alex Harris.
This upgrade provides finance professionals comprehensive and current data crucial for valuing firms in primary emerging markets, such as South America, Eastern Europe, the Middle East, and Asia. It equips finance experts worldwide with rigorous data to dissect and unlock latent potential utilizing a method previously inaccessible to them.
In corporate finance and investing, which are areas that I work in, I find myself doing double takes as I listen to politicians, market experts and economists making statements about company and market behavior that are fairy tales, and data is often my weapon for discerning the truth. Financing Flows 5. Aggregate operating numbers 3.
Global Finance: Can you briefly describe what your model does? Its going to change your equity, your retained earnings, your profits, your earnings per share, your EBIT, your EBITDAall these numbers would change. Joanne Horton: Yes. Whats the likelihood that fraud will take place in the future? And its incredibly difficult.
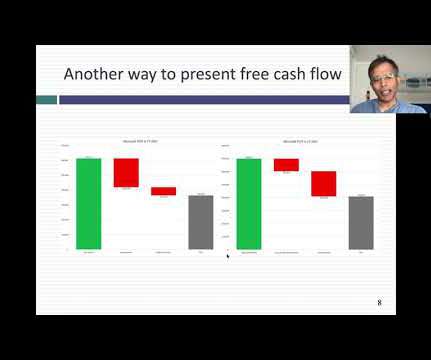
Free cash flow is one of the most dangerous terms in finance, and I am astonished by how it can be bent to mean whatever investors or managers want it to, and used to advance their sales pitches. Thus, we start with operating income or earnings before interest and taxes (EBIT) replacing net income. (I
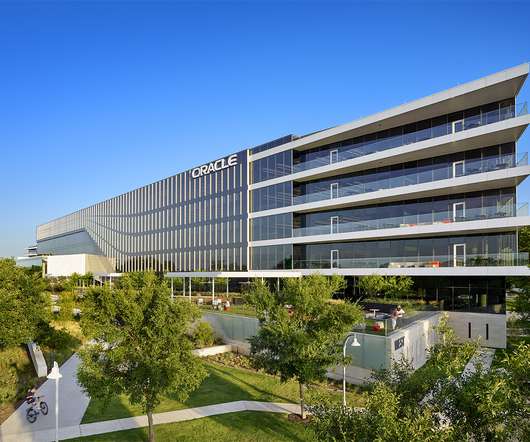
Oracle’s five-year share price chart is shown below: Source: Yahoo Finance, [link]. The Trading Comparables analysis resulted in a valuation range of $174 billion to $391 billion, by applying the observed trading multiples EV/EBITDA, EV/EBIT and P/E. This represents an annual return of 15.6% Valutico Analysis.
Oracle’s five-year share price chart is shown below: Source: Yahoo Finance, [link]. The Trading Comparables analysis resulted in a valuation range of $174 billion to $391 billion, by applying the observed trading multiples EV/EBITDA, EV/EBIT and P/E. This represents an annual return of 15.6% Valutico Analysis.
That is where the cost of capital, the Swiss Army Knife of finance that I wrote about in my sixth data update update , comes into play as a debt optimizing tool. While these choices can be overwhelming for some companies, who then trust bankers to tell them what to do, the truth is that the first principles of debt design are simple.
We organize all of the trending information in your field so you don't have to. Join 8,000+ users and stay up to date on the latest articles your peers are reading.
You know about us, now we want to get to know you!
Let's personalize your content
Let's get even more personalized
We recognize your account from another site in our network, please click 'Send Email' below to continue with verifying your account and setting a password.


Let's personalize your content