This site uses cookies to improve your experience. To help us insure we adhere to various privacy regulations, please select your country/region of residence. If you do not select a country, we will assume you are from the United States. Select your Cookie Settings or view our Privacy Policy and Terms of Use.
Cookie Settings
Cookies and similar technologies are used on this website for proper function of the website, for tracking performance analytics and for marketing purposes. We and some of our third-party providers may use cookie data for various purposes. Please review the cookie settings below and choose your preference.
Used for the proper function of the website
Used for monitoring website traffic and interactions
Cookie Settings
Cookies and similar technologies are used on this website for proper function of the website, for tracking performance analytics and for marketing purposes. We and some of our third-party providers may use cookie data for various purposes. Please review the cookie settings below and choose your preference.
Strictly Necessary: Used for the proper function of the website
Performance/Analytics: Used for monitoring website traffic and interactions
EBITDA: What’s It Worth? Frequently, the answer is tied to a multiple of EBITDA (earnings before interest, taxes, depreciation and amortization), leaving the further question, “What is EBITDA worth as a key factor in value metrics?”. EBITDA is probably the most common approach today. Johnson , M&AMI.
With a market capitalization of €395 billion, it is the most valuable company in Europe. The Trading Comparables analysis resulted in a valuation range of €305 billion to €492 billion by applying the observed trading multiples EV/Sales, EV/EBITDA, EV/EBIT and P/E. appeared first on Valutico.
Valuations using multiples is one of the three main approaches to valuing a business, sometimes referred to as the ‘market-based approach’. The ratio used might be EV/EBITDA, EV/Sales, P/E or another, depending on the valuation performed and the type of business being valued. This EBITDA multiple is the EV/EBITDA ratio.
Valuations using multiples is one of the three main approaches to valuing a business, sometimes referred to as the ‘market-based approach’. The ratio used might be EV/EBITDA, EV/Sales, P/E or another, depending on the valuation performed and the type of business being valued. This EBITDA multiple is the EV/EBITDA ratio.
A useful tip is to check for consistency between the forecast margins and historical margins—EBITDA margin, EBIT margin, and Net Income margin. Hockey stick-like growth in your DCF projections may indicate these projections are not realistic. inflation). the value of all its shares added up).
The market leader for CRM software is currently trading at around $133 per share, down more than 50% from its all-time-high of $300 per share, achieved in November 2021. . The current price of $133 represents a market capitalization of $145 billion. Weekly Valuation – Valutico | 6 December 2022. Link to detailed valuation.
The market leader for CRM software is currently trading at around $133 per share, down more than 50% from its all-time-high of $300 per share, achieved in November 2021. . The current price of $133 represents a market capitalization of $145 billion. Weekly Valuation – Valutico | 6 December 2022. Link to detailed valuation.
While the current market capitalisation was USD 1.42 The trading comparables approach confirms this view with the median EV/EBITDA, EV/EBIT and P/E multiples applied to the 2023 forecasts producing a valuation range of USD 600 million to USD 1.1 Result: Overvalued for everyone except Amazon but likely Undervalued for Amazon.
This led to a market cap of €78 billion after the IPO, which is higher than the current market capitalization of its parent company Volkswagen AG (€72 billion). . In the fo rmer, we compared Porsche with peers such as BMW, Mercedes-Benz, Ferrari and Ford using thethe EV/EBITDA and the EV/EBIT multiples.
billion with EBIT margin increasing to 16.6% The IPO of ABB’s E-Mobility division was planned for mid-2022 but has been delayed due to unfavorable market conditions. Currently the company is trading at CHF 30 per share with a market capitalization of CHF 56.1 In comparison to ABB’s market capitalization of CHF 56.1
billion with EBIT margin increasing to 16.6% The IPO of ABB’s E-Mobility division was planned for mid-2022 but has been delayed due to unfavorable market conditions. Currently the company is trading at CHF 30 per share with a market capitalization of CHF 56.1 In comparison to ABB’s market capitalization of CHF 56.1
billion, driven by lower interest expense and lower non-cash impairment losses, offset by lower Adjusted EBITDA, an accrual related to the securities class action lawsuit, and higher supply chain and commodity costs. Adjusted EBITDA decreased 5.8% billion by applying the observed trading multiples EV/Sales, EV/EBITDA, EV/EBIT and P/E.
billion, driven by lower interest expense and lower non-cash impairment losses, offset by lower Adjusted EBITDA, an accrual related to the securities class action lawsuit, and higher supply chain and commodity costs. Adjusted EBITDA decreased 5.8% billion by applying the observed trading multiples EV/Sales, EV/EBITDA, EV/EBIT and P/E.
Anheuser-Busch InBev, a Belgium-based beer brewing and distribution giant operating in the global market, has an impressive portfolio of over 500 beer brands including Budweiser, Becks, Stella Artois and Corona. The company also was able to increase its EBITDA by 6.5% with an overall EBITDA margin of 35.2%. in non-beer products.
Anheuser-Busch InBev, a Belgium-based beer brewing and distribution giant operating in the global market, has an impressive portfolio of over 500 beer brands including Budweiser, Becks, Stella Artois and Corona. The company also was able to increase its EBITDA by 6.5% with an overall EBITDA margin of 35.2%. in non-beer products.
There are three primary approaches under which most valuation methods sit, which include the income approach, market approach, and asset-based approach. The market approach compares the company to similar publicly traded businesses, or those recently sold or involved in some transaction. How Do I Value a Business?
Recent Financial Performance In Q1 2023, Marriott exceeded market expectations with gross lodging fees reaching USD 1.13 billion and an EBITDA of USD 1.09 billion by applying the observed trading multiples EV/Sales, EV/EBITDA, EV/EBIT and P/E. In comparison to Marriott market capitalization of USD 52.9
Connecting NGL supply across the Mid-Continent, Permian, and Rocky Mountain regions to vital market centers, Oneok plays a pivotal role in the country’s energy industry. 2022 saw a robust cash and capital structure with a staggering USD 967 million adjusted EBITDA in Q4, up by 14% from the previous year. billion to USD 32.3
The company has the goal to consistently grow its market share and ultimately reach sales of $200 billion in the next few years. This target should be accomplished by increasing the market share not only in their consumer segment but also by selling more products to professionals. . Share Price Performance. Valutico Analysis.
The company has the goal to consistently grow its market share and ultimately reach sales of $200 billion in the next few years. This target should be accomplished by increasing the market share not only in their consumer segment but also by selling more products to professionals. . Share Price Performance. Valutico Analysis.
Share Price Performance The company has a market capitalization of more than $32 billion, however, its share price is still down roughly 30% from highs set last year. billion by applying the observed trading multiples EV/Sales, EV/EBITDA, EV/EBIT and P/E. In comparison to Devon Energy market capitalization of USD 31.7
After following the rest of the market down during the early Covid-19 period, the share price steadily increased, achieving an all time high of $250 per share in July 2021. The Trading Comparables analysis resulted in a valuation range of $257 billion to $296 billion by applying the observed trading multiples EV/EBITDA, EV/EBIT and P/E.
In practice, professionals rely on several results, assessed at different levels of the income statement: - the gross operating surplus (EBIT or EBITDA) - net operating surplus (ENE or EBIT) - the Current Result Before Tax (RCAI) - Net Income (NR) - Self-Financing Capacity (CAF) or operating cash flow. EBITDA and EBIT).
Recent Financial Performance Despite the challenging market conditions, Philip Morris has recently demonstrated a resilient financial performance. billion to USD 108 billion by applying the observed trading multiples EV/Sales, EV/EBITDA, EV/EBIT and P/E. Their Q1 2023 results exceeded expectations, reporting USD 1.38
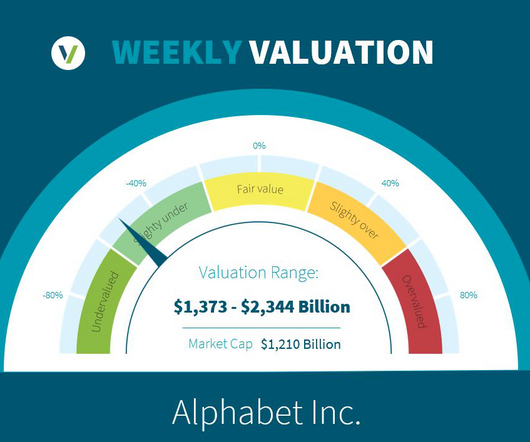
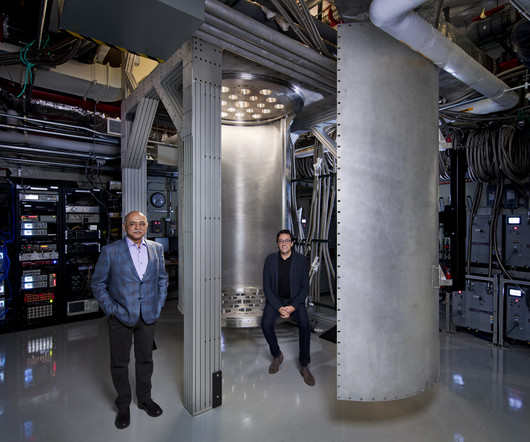
The company is one of the world’s largest companies with a market capitalization of $1.34 The Trading Comparables analysis resulted in a valuation range of $1,517 billion to $2,344 billion by applying the observed trading multiples EV/EBITDA, EV/EBIT and P/E.
Emphasizing the company’s robust market performance, Nvidia’s market capitalization has hit the USD 1 trillion milestone, joining the elite league of tech behemoths such as Apple and Amazon. Reflecting strong Q1 2023 performance and favorable market trends, NVIDIA’s current share price stands at USD 430.39.
Alibaba is a Chinese technology company, participating in the local and international e-commerce, cloud and the digital media markets. We used the observed trading multiples EV/EBITDA, EV/EBIT and P/E of a group of similar listed peers for our Trading Comparables analysis, arriving at a valuation range of $193 billion to $237 billion.
Stock Market Implications In the recent past, most notably in 2020 and 2021, Netflix experienced considerable growth in the stock market. billion to USD 150 billion, by utilizing observed metrics such as EV/EBITDA, EV/EBIT, and P/E ratios. Due to the COVID-19 shutdowns in 2020, new subscriptions increased dramatically.
Stock Market Implications Meta Platforms’ stock has been recovering steadily, now just 20% below its September 2021 peak. The share price, having grown by 159% in 2023, and a 250% rise from its 52-week low, suggests the market’s faith in a business turnaround. With Q2 2023 revenue forecasted at $31.0B, marking a ~7.6%
The Trading Comparables analysis resulted in a valuation range of $121 billion to $150 billion by applying the observed trading multiples EV/EBITDA and EV/EBIT. In comparison to Boeing’s market capitalization of $127 billion we suggest that the company is fairly valued. billion to $150 billion.
The Trading Comparables analysis resulted in a valuation range of $83 billion to $118 billion, by applying the observed trading multiples EV/EBITDA, EV/EBIT and P/E. In comparison to Starbucks’ market capitalization of $120 billion we suggest that the company is slightly overvalued. . billion to $118 billion.
The Trading Comparables analysis resulted in a valuation range of $83 billion to $118 billion, by applying the observed trading multiples EV/EBITDA, EV/EBIT and P/E. In comparison to Starbucks’ market capitalization of $120 billion we suggest that the company is slightly overvalued. . billion to $118 billion.
Share Price Performance IBM has seen a positive return of almost 20% in the past two years, largely due to favorable market trends and the normalization of monetary policy, which benefited value stocks in particular. In comparison to IBM market capitalization of USD 114 billion we suggest that the company is undervalued.
Tencent Holdings has experienced ups and downs in the stock market over the past five years. billion to HKD 3,905 (USD 501) billion, by applying the observed trading multiples EV/EBITDA, EV/EBIT and P/E. In comparison to Tencent’s market capitalization of HKD 3,070 (USD 386.6) Share Price Performance.
This strong financial performance is also reflected in the stock market as TotalEnergies is currently trading at €57 per share, which is a year-on-year increase of roughly 30%. At TotalEnergies’ current market capitalization of €148 billion, our analysis suggests that the company is undervalued.
Tencent Holdings has experienced ups and downs in the stock market over the past five years. billion to HKD 3,905 (USD 501) billion, by applying the observed trading multiples EV/EBITDA, EV/EBIT and P/E. In comparison to Tencent’s market capitalization of HKD 3,070 (USD 386.6) Share Price Performance.
Tencent Holdings has experienced ups and downs in the stock market over the past five years. billion to HKD 3,905 (USD 501) billion, by applying the observed trading multiples EV/EBITDA, EV/EBIT and P/E. In comparison to Tencent’s market capitalization of HKD 3,070 (USD 386.6) Share Price Performance.
This strong financial performance is also reflected in the stock market as TotalEnergies is currently trading at €57 per share, which is a year-on-year increase of roughly 30%. At TotalEnergies’ current market capitalization of €148 billion, our analysis suggests that the company is undervalued.
As per the statistics published by Nilson Report in May 2023, the market share of Visa in the total purchase transactions on global general card networks for 2022 was 39% whereas the shares of Mastercard and UnionPay were 24% and 34% respectively. Visa is currently the 11th most valuable company globally in terms of market capitalization.
The Trading Comparables analysis resulted in a valuation range of GBP 98 (USD 199) billion to GBP 137 (USD 166) billion by applying the observed trading multiples EV/EBITDA, EV/EBIT, P/E and P/B. In comparison to BP’s market capitalization of GBP 101 (USD 122) billion we suggest that the company is slightly undervalued.
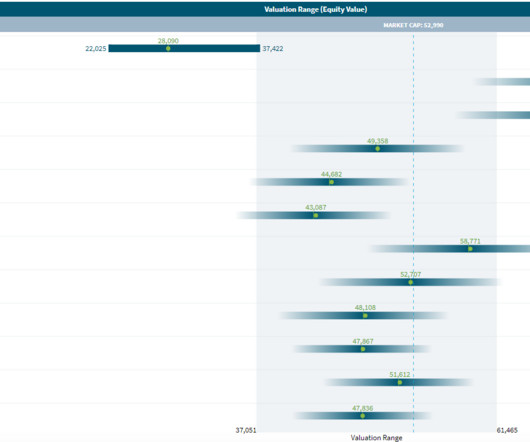
We came up with this valuation range by using the observed trading multiples EV/EBITDA, EV/EBIT and P/E of peers such as Nike and Puma. . By combining these two approaches we arrive at a fairly wide valuation range of €15.6 billion to €44.9
We came up with this valuation range by using the observed trading multiples EV/EBITDA, EV/EBIT and P/E of peers such as Nike and Puma. . By combining these two approaches we arrive at a fairly wide valuation range of €15.6 billion to €44.9
Our Trading Comparables analysis, using the multiples EV/EBITDA, EV/EBIT and P/E, indicates a value range of PLN 5 billion ($1 billio n) to PLN 9 ($1.9 With a current market cap of PLN 12.2 Our DCF WACC analysis resulted in a valuation of PLN 10.7 billion ($2.2 billion), by applying a WACC of 9.9 %. billion ($2.2 billion ($2.5
These examples cover a range of topics, including discounted cash flow (DCF) analysis, comparable company analysis (CCA), and market multiples. Continuous Learning in Valuation Given the dynamic nature of financial markets, continuous learning is essential for professionals in valuation. What is Free Cash Flow to Equity?
We organize all of the trending information in your field so you don't have to. Join 8,000+ users and stay up to date on the latest articles your peers are reading.
You know about us, now we want to get to know you!
Let's personalize your content
Let's get even more personalized
We recognize your account from another site in our network, please click 'Send Email' below to continue with verifying your account and setting a password.


Let's personalize your content