This site uses cookies to improve your experience. To help us insure we adhere to various privacy regulations, please select your country/region of residence. If you do not select a country, we will assume you are from the United States. Select your Cookie Settings or view our Privacy Policy and Terms of Use.
Cookie Settings
Cookies and similar technologies are used on this website for proper function of the website, for tracking performance analytics and for marketing purposes. We and some of our third-party providers may use cookie data for various purposes. Please review the cookie settings below and choose your preference.
Used for the proper function of the website
Used for monitoring website traffic and interactions
Cookie Settings
Cookies and similar technologies are used on this website for proper function of the website, for tracking performance analytics and for marketing purposes. We and some of our third-party providers may use cookie data for various purposes. Please review the cookie settings below and choose your preference.
Strictly Necessary: Used for the proper function of the website
Performance/Analytics: Used for monitoring website traffic and interactions
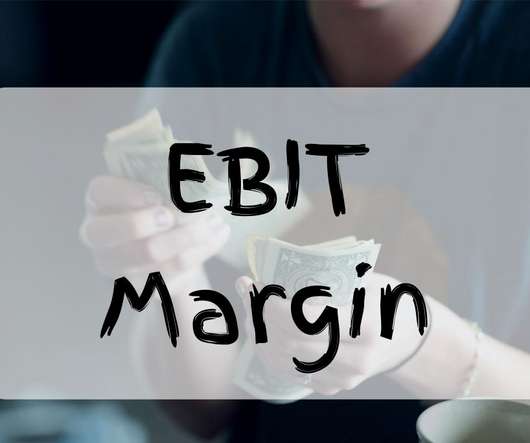
Definition of EBIT Margin. EBIT margin stands for Earning Before Interest and Tax margin. The higher the EBIT the better it is for the firm. What is the Formula for the EBIT Margin? EBIT margin is calculated by dividing EBIT by revenue. EBIT margin = EBIT / Revenue . EBIT Margin in Practice.
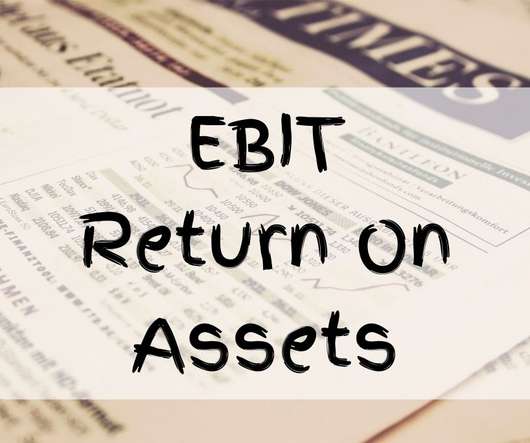
Definition of EBIT Return on Assets. EBIT return on asset measures the firm’s earnings before interest and tax with respect to the firm’s total asset. The reason EBIT is used and not net income is because EBIT focuses only on operating cash flows. . What is the Formula for EBIT Return on Assets? EBIT = Revenue ?
5 Simple Sense-Checks That Vastly Improve Your BusinessValuation (According to the Experts). It’s easy to get tripped up by detailed assumptions when valuing a business, especially if you’re in a hurry to produce results. Valuing a business is a precise exercise that warrants lots of checking and double-checking of assumptions.
EBIT and EBITDA are two measurements of business profitability. This article will discuss two accounting terms used to build the FCFF - EBIT and EBITDA (Earnings Before Interest, Taxes, Depreciation, and Amortization). Both EBIT and EBITDA are indicators of the firm's profitability. . What is EBIT? What is EBITDA?
If you’re interested in selling your business, you may be doing some research on how businesses are valued. There are lots of misleading theories out there about how to best value a business, including using a multiple of revenue (not good) or a multiple of net profit (even worse).
The formula for interest coverage is earnings before interest and taxes (EBIT) divided by interest expenses. Each metric listed above can help advisors and business owners identify business trends, strengths and weaknesses. The lower the ratio, the greater the debt and possibility of bankruptcy.
Want to know Methods of BusinessValuation by Their Profitability? Methods of businessvaluation by their profitability are presented below. The differences are in the employee profit-sharing and in the extraordinary result, taken into account in the EBIT and EBITDA. Net Operating Surplus Multiples (ENE or EBIT).
NOPAT can be calculated through the following formula: EBIT x (1 – tax rate). EBIT is the earnings before interest and tax. To find the ROIC, you divide NOPAT by Invested Capital. NOPAT ÷ Invested Capital. The NOPAT is the net operating profit after tax. ROIC in Practice. Tony wanted to open up a shop that sells shoes.
EBIT margin is likely to expand significantly through better cost control. We see an EBIT margin around 15% as a maximum for this Ralph Lauren. After the revenue rebound in 22E, we assume revenue growth to normalize. Going forward, we see the revenue growth potential between 3-4%. So, we already have an optimistic bias.
EBIT margin expansion in 22E probably only short-lived. Going forward, we see the EBIT margin to range between 7-8%. After the revenue rebound in 22E, we assume revenue growth to normalize. Going forward, we see poor revenue growth potential between 2-3%. Long-term share price performance potential. Free cash flow – Kohl’s.
If it can maintain a 6-7% EBIT margin it changes the market’s assessment of the company. If it can maintain a 6-7% EBIT margin, then this could be a catalyst for share price performance. Mainly from fierce price competition, higher labor costs and the recent chip shortage. Reducing reliance on global supply chains. P&L – Hyundai.
Its calculation involves the subtraction of capital expenditures, changes in working capital, and taxes from the company's Earnings Before Interest and Taxes (EBIT). Exploration of Widely Used Multiples: Valuation often involves comparing a company's metrics to those of its peers. What is Free Cash Flow to Equity?
Competitors like VW and GM only achieve EBIT margin between 5 and 7%. The company targets to keep its ROE around 10% (with the help of its buyback program). Toyota is among the most consistent and most profitable car makers in the world. The company has moderately high leverage. Free cash flow – Toyota.
EBIT margin expansion in 21E likely to stay. I expect dividend yield over the near-term to range between 2.5-3.5%. Ratios – Volvo. After the revenue rebound in 22E, we assume revenue growth to normalize. Beyond 2022, I see a healthy annual revenue growth potential around 5%. Long-term share price performance potential.
4-5 years from now, this segment could contribute GPB100m, equaling around 15-20% of overall EBIT. Fundamentals, Valuation, Momentum, and Risk (FVMR). In 2021, it signed 40 new exclusive partnerships with hotels. Being a one-stop solution with attractive deals helps to drive growth. FVMR Scorecard – EasyJet.
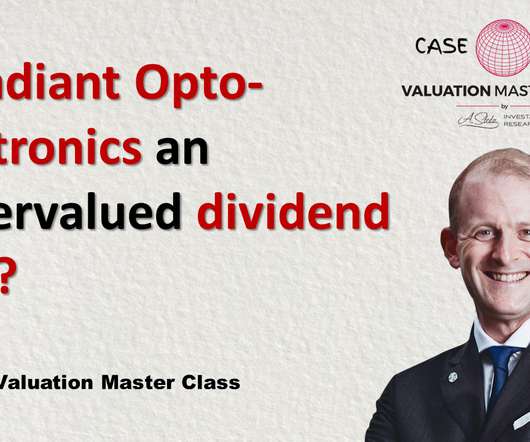
EBIT margin on a slightly lower level given an increase of low-cost manufacturers. The company has almost no long-term debt, thought is does have short term debt, leading to a negative net debt-to-equity ratio of 0.7x. Ratios – Radiant Opto-Electronics Corporation. Dividend payout is high which means it has an attractive dividend yield.
It will be a challenge for the company to drive its EBIT margin to the industry average of 7-9%. Net margin could finally turn positive in 2023. Tata has been among the worst profitable car companies in the past years. The company has relatively high leverage. Free cash flow – Tata Motors.
Aerospace’s EBIT margin of 20.5% The primary drivers are a rebound in commercial airline industry and increase in US defense budget. This segment plays a critical role in realizing future growth and enhancing profitability. vs. total company’s margin of 15.6% (5-yr avg.). Industry growth: 7-8% CAGR until 2030 expected.
From experience of over 1000 transactions , we’ve pulled together some of the best practices from our most experienced investors and snippets of knowledge from our own acquisitions to provide some guidance for new and seasoned buyers alike to answer: how do you value a website or internet business? Buying an online business?
The critical data equips financial professionals with relevant information for accurate businessvaluation and offers a verifiable benchmark for real-time transactions. Users can also delve into in-depth deal specifics, like stake purchases, deal amounts, and crucial multiples such as EV/Sales, EV/EBITDA, EV/EBIT and P/E.
We organize all of the trending information in your field so you don't have to. Join 8,000+ users and stay up to date on the latest articles your peers are reading.
You know about us, now we want to get to know you!
Let's personalize your content
Let's get even more personalized
We recognize your account from another site in our network, please click 'Send Email' below to continue with verifying your account and setting a password.


Let's personalize your content