This site uses cookies to improve your experience. To help us insure we adhere to various privacy regulations, please select your country/region of residence. If you do not select a country, we will assume you are from the United States. Select your Cookie Settings or view our Privacy Policy and Terms of Use.
Cookie Settings
Cookies and similar technologies are used on this website for proper function of the website, for tracking performance analytics and for marketing purposes. We and some of our third-party providers may use cookie data for various purposes. Please review the cookie settings below and choose your preference.
Used for the proper function of the website
Used for monitoring website traffic and interactions
Cookie Settings
Cookies and similar technologies are used on this website for proper function of the website, for tracking performance analytics and for marketing purposes. We and some of our third-party providers may use cookie data for various purposes. Please review the cookie settings below and choose your preference.
Strictly Necessary: Used for the proper function of the website
Performance/Analytics: Used for monitoring website traffic and interactions
I looked at global equities, broken down by region of the world, and in US dollars, to allow for direct comparison: India is the only region of the world to post positive returns, in US dollar terms, in the third quarter, and is the best performing market of the year, running just ahead of the US; note again that of the $5.2
Heading into 2023, US equities looked like they were heading into a sea of troubles, with inflation out of control and a recession on the horizon. Breaking equities down by sub-region, and looking across the globe, I computed the change in aggregate market capitalization, by region: While US stocks accounted for about $9.5
In my second data update post from the start of this year , I looked at US equities in 2022, with the S&P 500 down almost 20% during the year and the NASDAQ, overweighted in technology, feeling even more pain, down about a third, during the year. US Equities in 2023: Into the Weeds! that was lost last year.
In my last post, I looked at equities in 2023, and argued that while they did well during 2023, the bounce back were uneven, with a few big winning companies and sectors, and a significant number of companies not partaking in the recovery.
In my last post , I noted that the US has extended its dominance of global equities in recent years, increasing its share of market capitalization from 42% in at the start of 2023 to 44% at the start of 2024 to 49% at the start of 2025.
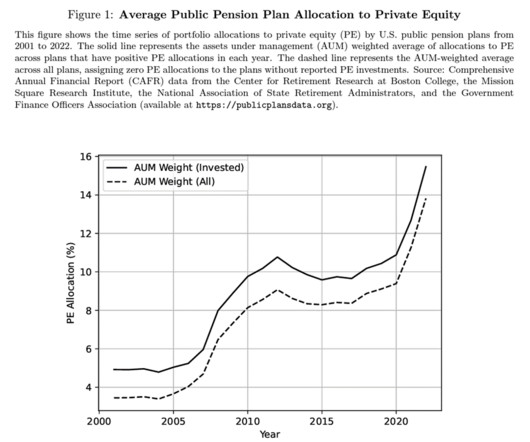
Posted by Arthur Korteweg (USC), Stavros Panageas (UCLA), and Anand Systla (UCLA), on Monday, February 3, 2025 Editor's Note: Arthur Korteweg is an Associate Professor of Finance and Business Economics at USC Marshall School of Business, Stavros Panageas is a Professor of Finance at UCLA Anderson School of Management, and Anand Systla is a Ph.D.
It is the end of the first full week in 2025, and my data update for the year is now up and running, and I plan to use this post to describe my data sample, my processes for computing industry statistics and the links to finding them. In the table below, we compare the changes in regional market capitalizations (in $ millions) over time.
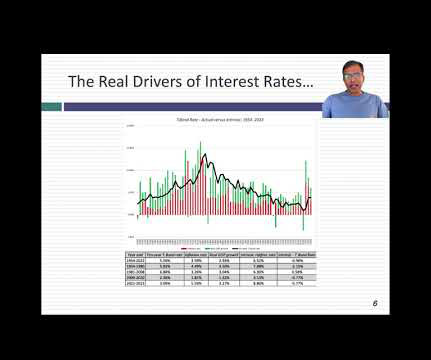
In the first five posts, I have looked at the macro numbers that drive global markets, from interest rates to riskpremiums, but it is not my preferred habitat. In this role, the cost of capital is an opportunity cost, measuring returns you can earn on investments on equivalent risk.
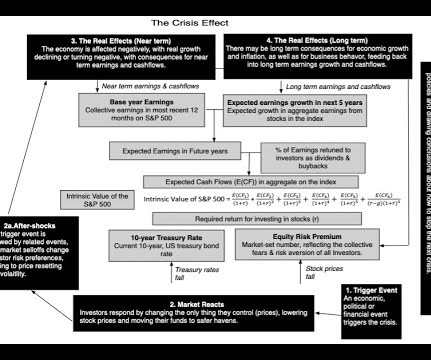
Not surprisingly, the markets opened down on Thursday and spent the next two days in that mode, with US equity indices declining almost 10% by close of trading on Friday. US equities had the biggest decline in dollar value terms, losing $5.3 trillion in value last week, a 9.24% decline in value from the Friday close on March 28, 2025.
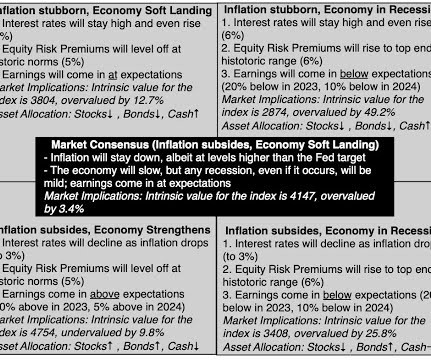
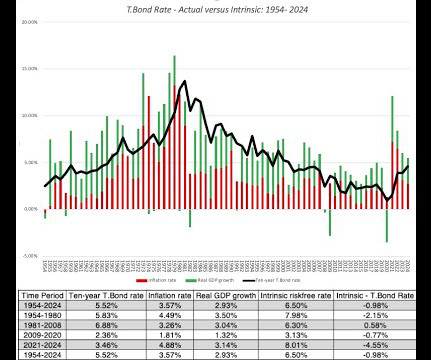
Entering 2025, the gap between intrinsic and treasury rates has narrowed , as the market consensus settles in on expectations that inflation will stay about the Fed-targeted 2% and that economic activity will be boosted by tax cuts and a business-friendly administration.
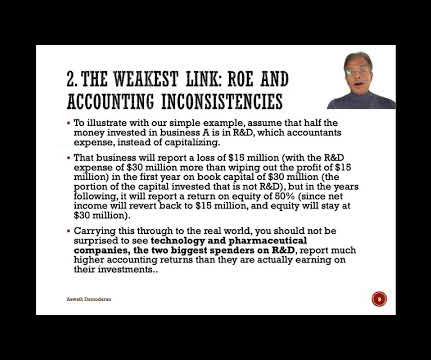
While I was working on my last two data updates for 2025, I got sidetracked, as I am wont to do, by two events. With these characteristics, the accounting balance sheets for these companies will be identical right after they start up, and the book value of equity will be $60 million in each company.
For the market, it is often built on papers (or books) that look at the historical data on what equity markets have delivered as returns over long periods, relative to what you would have made investing elsewhere. Contrarian Investing: The Psychological Tests! In the abstract, it is easy to understand the appeal of contrarian investing.
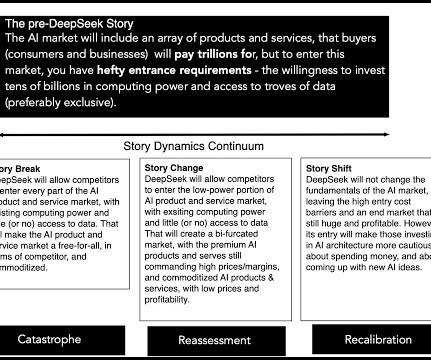
I graph the performance of the five AI stocks highlighted in the earlier section, throwing in the Meta and Microsoft for good measure, on a daily basis in 2025. YouTube Video Nvidia Valuations Nvidia valuation in September 2024 (Pre DeepSeek) Nvidia valuation in January 2025 (Post DeepSeek)
17] See [link] (showing the United States has among the lowest equityriskpremiums in the world); Luzi Hail and Christian Leuz, International Differences in the Cost of Equity Capital: Do Legal Institutions and Securities Regulation Matter?, 11, 2025). [20] 12, 2025). [21] 12, 2025). [22]
Strong empirical evidence shows the United States has a lower cost of equity capital than comparable countries and that this lower cost is attributable in part to an institutional design that protects the independence of securities regulators and assures strong enforcement. In the United States, the cost of capital is lower than elsewhere.
The Debt Trade off As a prelude to examining the debt and equity tradeoff, it is best to first nail down what distinguishes the two sources of capital. To me, the key distinction between debt and equity lies in the nature of the claims that its holders have on cash flows from the business.
The results, broken down broadly by geography are in the table below: As you can see, the aggregate market cap globally was up 12.17%, but much of that was the result of a strong US equity market. That process of risk analysis and estimating riskpremiums starts by understanding why some countries are riskier than others.
Thus, my estimates of equityriskpremiums, updated every month, are not designed to make big statements about markets but more to get inputs I need to value companies. That said, to value companies today, I have no choice but to bring in the economics and politics of the world that these companies inhabit.
We’ve seen dramatic improvements with companies addressing maturities due in 2025, but also a lot of progress on maturities due out to 2026. The risk looks a lot better, and all those reasons support the soft-landing thesis. There are certain sectors that we think are offering better risk/reward.
We organize all of the trending information in your field so you don't have to. Join 8,000+ users and stay up to date on the latest articles your peers are reading.
You know about us, now we want to get to know you!
Let's personalize your content
Let's get even more personalized
We recognize your account from another site in our network, please click 'Send Email' below to continue with verifying your account and setting a password.


Let's personalize your content