This site uses cookies to improve your experience. To help us insure we adhere to various privacy regulations, please select your country/region of residence. If you do not select a country, we will assume you are from the United States. Select your Cookie Settings or view our Privacy Policy and Terms of Use.
Cookie Settings
Cookies and similar technologies are used on this website for proper function of the website, for tracking performance analytics and for marketing purposes. We and some of our third-party providers may use cookie data for various purposes. Please review the cookie settings below and choose your preference.
Used for the proper function of the website
Used for monitoring website traffic and interactions
Cookie Settings
Cookies and similar technologies are used on this website for proper function of the website, for tracking performance analytics and for marketing purposes. We and some of our third-party providers may use cookie data for various purposes. Please review the cookie settings below and choose your preference.
Strictly Necessary: Used for the proper function of the website
Performance/Analytics: Used for monitoring website traffic and interactions
If you have been reading my posts, you know that I have an obsession with equity riskpremiums, which I believe lie at the center of almost every substantive debate in markets and investing. That said, I don't blame you, if are confused not only about how I estimate this premium, but what it measures.
After a year of being pummeled by markets, what are investors pricing stocks to make in 2023 and beyond? The first is that the use of historical riskpremiums is predicated on the belief that the future will look like the past, and the world, in all its dimensions, has changed dramatically over the last few decades.
In every introductory finance class, you begin with the notion of a risk-free investment, and the rate on that investment becomes the base on which you build, to get to expected returns on risky assets and investments. What is a riskfree investment? Why does the risk-freerate matter?
A few weeks ago, I posted my first data update pulling together what I had learned from looking at the data in 2023, and promised many more on the topic. In the month since, I have added two more data updates, one on US equities and one on interest rates , but my attention was drawn away by other interesting stories.
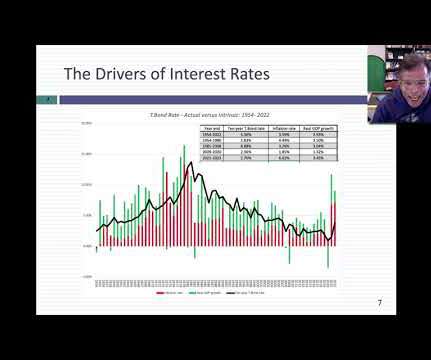
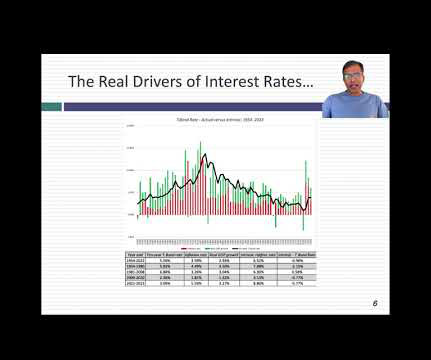
The rise in rates transmitted to corporate bond market rates, with a concurrent rise in default spreads exacerbating the damage to investors. That view has never made sense, because central banking power over rates is at the margin, and the key fundamental drivers of rates are expected inflation and real growth.
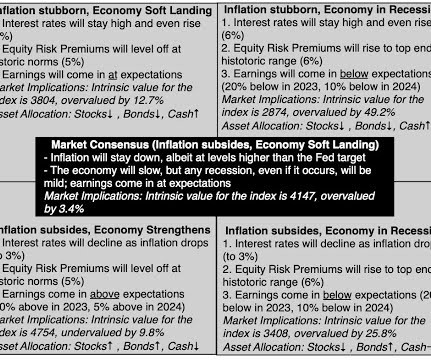
As we enter the last quarter of 2023, it has been a roller coaster of a year. In the first half of the year, we had positive surprises on both fronts, as inflation dropped after than expected and the economy stayed resilient, allowing for a comeback on stocks, which I wrote about in a post in July 2023.
In my last post, I looked at equities in 2023, and argued that while they did well during 2023, the bounce back were uneven, with a few big winning companies and sectors, and a significant number of companies not partaking in the recovery. The Fed Effect: Where's the beef?
It is worth noting that year 10 in that valuation would be 2023, and Tesla's revenues in 2022 were not that far off at $73 billion, albeit with more potential for growth.) The Market : The US equity market in January 2023 looks very different from the market at the start of 2022.
billion in gross profit in the last twelve months leading into 2023, but operating income drops off to $6.4 Finally, I look at the aggregated values across all companies on all three income measures, across all global companies, again broken down by sector: Collectively, global companies reported $16.9 billion and need income is only $4.3
In my last three posts, I looked at the macro (equity riskpremiums, default spreads, riskfreerates) and micro (company risk measures) that feed into the expected returns we demand on investments, and argued that these expected returns become hurdle rates for businesses, in the form of costs of equity and capital.
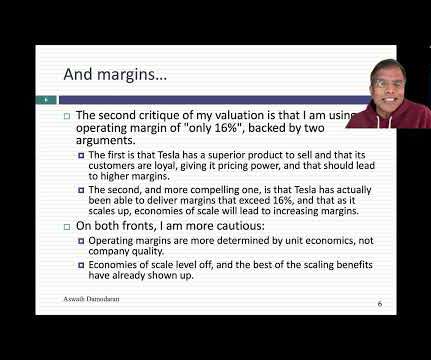
The first of the is as companies scale up, there will be a point where they will hit a growth wall, and their growth will converge on the growth rate for the economy. Lowering revenue growth to 15% in 2023 and raising it to 33% in 2024 will deliver almost the same value for the company, as what I get with my smoothed-out values.
In a post at the start of 2021 , I argued that while stocks entered the year at elevated levels, especially on historic metrics (such as PE ratios), they were priced to deliver reasonable returns, relative to very low riskfreerates (with the treasury bond rate at 0.93% at the start of 2021).
For three decades, China has won this battle, but in 2023, the battleground seems to be shifting in favor of India, but it is still too early to make a judgment on whether this is a long term change, or just a hiccup.
In my last data updates for this year, I looked first at how equity markets rebounded in 2023 , driven by a stronger-than-expected economy and inflation coming down, and then at how interest rates mirrored this rebound. Globally, health care has the highest percentage of money-losing companies and utilities have the lowest.
RiskPremiums : You cannot make informed financial decisions, without having measures of the price of risk in markets, and I report my estimates for these values for both debt and equity markets. I extend my equity riskpremium approach to cover other countries, using sovereign default spreads as my starting point, at this link.
In my last post , I noted that the US has extended its dominance of global equities in recent years, increasing its share of market capitalization from 42% in at the start of 2023 to 44% at the start of 2024 to 49% at the start of 2025.
I will follow up by examining changes in corporate bond rates, across the default ratings spectrum, trying to get a measure of how the price of risk in bond markets changed during 2024. They made a mild comeback in 2023 and that recovery continued in 2024.
I aggregated the market capitalizations of all stocks at the end of 2023 and the end of 2024, and computed the percentage change. I am no expert on exchange rates, but learning to deal with different currencies in valuation is a prerequisite to valuing companies. Data Update 4 for 2025: Interest Rates, Inflation and Central Banks!
We organize all of the trending information in your field so you don't have to. Join 8,000+ users and stay up to date on the latest articles your peers are reading.
You know about us, now we want to get to know you!
Let's personalize your content
Let's get even more personalized
We recognize your account from another site in our network, please click 'Send Email' below to continue with verifying your account and setting a password.


Let's personalize your content