This site uses cookies to improve your experience. To help us insure we adhere to various privacy regulations, please select your country/region of residence. If you do not select a country, we will assume you are from the United States. Select your Cookie Settings or view our Privacy Policy and Terms of Use.
Cookie Settings
Cookies and similar technologies are used on this website for proper function of the website, for tracking performance analytics and for marketing purposes. We and some of our third-party providers may use cookie data for various purposes. Please review the cookie settings below and choose your preference.
Used for the proper function of the website
Used for monitoring website traffic and interactions
Cookie Settings
Cookies and similar technologies are used on this website for proper function of the website, for tracking performance analytics and for marketing purposes. We and some of our third-party providers may use cookie data for various purposes. Please review the cookie settings below and choose your preference.
Strictly Necessary: Used for the proper function of the website
Performance/Analytics: Used for monitoring website traffic and interactions
If you have been reading my posts, you know that I have an obsession with equityriskpremiums, which I believe lie at the center of almost every substantive debate in markets and investing. That said, I don't blame you, if are confused not only about how I estimate this premium, but what it measures.
In this post, I will begin by chronicling the damage done to equities during 2022, before putting the year in historical context, and then examine how developments during the year have affected expectations for the future. Actual Returns Your returns on equities come in one of two forms. Stocks: The What?
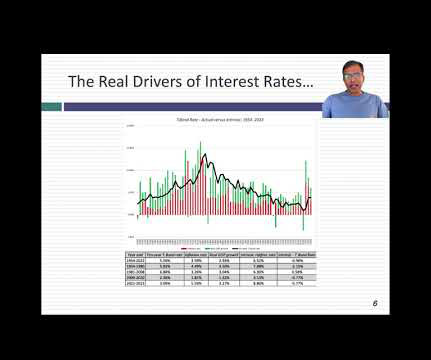
A few weeks ago, I posted my first data update pulling together what I had learned from looking at the data in 2023, and promised many more on the topic. In the month since, I have added two more data updates, one on US equities and one on interest rates , but my attention was drawn away by other interesting stories.
I am just not good at it, and the first six months of 2023 illustrate why market timing is often the impossible dream, something that every investor aspires to be successful at, but very few succeed on a consistent basis. Markets, as is their wont, live to surprise, and the first six months of 2023 has wrong-footed the experts (again).
If 2022 was an unsettling year for equities, as I noted in my second data post, it was an even more tumultuous year for the bond market. Historical Context In my earlier post, I noted that US equity market performance in 2022 made it the seventh worst year in stock market history, if you go back to 1928.
As we enter the last quarter of 2023, it has been a roller coaster of a year. In the first half of the year, we had positive surprises on both fronts, as inflation dropped after than expected and the economy stayed resilient, allowing for a comeback on stocks, which I wrote about in a post in July 2023.
In a third post on July 1, 2022 , I pointed to inflation as a key culprit in the retreat of risk capital, i.e., capital invested in the riskiest segments of every market, and presented evidence of the impact on riskpremiums (bond default spreads and equityriskpremiums) in markets.
Heading into 2023, US equities looked like they were heading into a sea of troubles, with inflation out of control and a recession on the horizon. In that post, I noted that if inflation subsided quickly, and the economy stayed out of a recession, stocks had upside, and that is the scenario that played out in 2023.
In my last post, I looked at equities in 2023, and argued that while they did well during 2023, the bounce back were uneven, with a few big winning companies and sectors, and a significant number of companies not partaking in the recovery. The Fed Effect: Where's the beef?
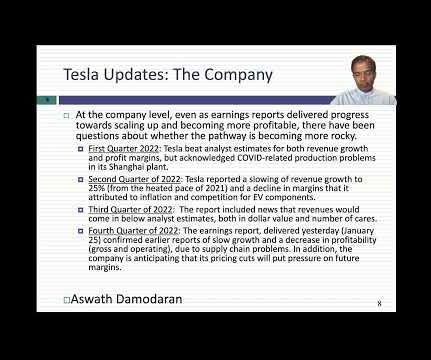
In its early years, Tesla was dependent on equity issuances for funding growth investments, and its liberal use of options to reward management (and especially Elon Musk) opened it up to criticism. The Market : The US equity market in January 2023 looks very different from the market at the start of 2022. per share in 2022.
When valuing or analyzing a company, I find myself looking for and using macro data (riskpremiums, default spreads, tax rates) and industry-level data on profitability, risk and leverage. In January 2023, I ended up with 47,913 publicly traded firms in my sample , with the pie chart below providing a geographic breakdown.
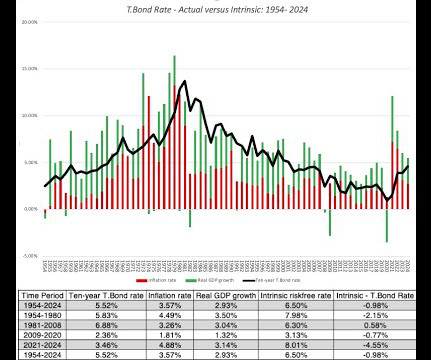
Expected returns for Risky Investments : The risk-free rate becomes the base on which you build to estimate expected returns on all other investments. For instance, if you read my last post on equityriskpremiums , I described the equityriskpremium as the additional return you would demand, over and above the risk free rate.
billion in gross profit in the last twelve months leading into 2023, but operating income drops off to $6.4 Finally, I look at the aggregated values across all companies on all three income measures, across all global companies, again broken down by sector: Collectively, global companies reported $16.9 billion and need income is only $4.3
In my last three posts, I looked at the macro (equityriskpremiums, default spreads, risk free rates) and micro (company risk measures) that feed into the expected returns we demand on investments, and argued that these expected returns become hurdle rates for businesses, in the form of costs of equity and capital.
DEBRA Proposal (« Debt-Equity Bias Reduction Allowance). In early May, the European Commission unveiled its proposal for a "DEBRA" (Debt-equity bias reduction allowance) Directive, aimed at encouraging companies to finance their investments with equity and capital contributions, instead of resorting to loans (bank or other).
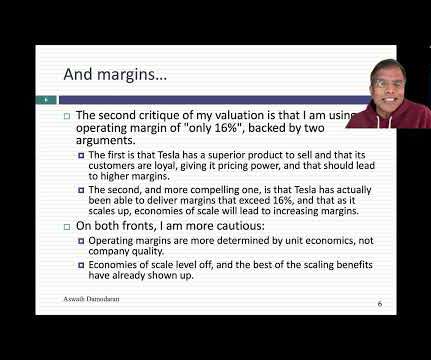
Finally, my starting cost of capital of 10.15% reflects the reality that the riskfree rate and equityriskpremiums have risen over 2022, and my ending number of 9% is an indication that I expect Tesla to become less risky over time. and 10.9%.
He was a on the Board of Trustees of the International Valuation Standards Council finishing his second term in 2023. He is a frequent presenter on valuation topics, and is currently a subject matter expert on the Appraisal Foundation’s working group preparing a Valuation Advisory on the Company-Specific RiskPremium.
In my last data updates for this year, I looked first at how equity markets rebounded in 2023 , driven by a stronger-than-expected economy and inflation coming down, and then at how interest rates mirrored this rebound. Globally, health care has the highest percentage of money-losing companies and utilities have the lowest.
For three decades, China has won this battle, but in 2023, the battleground seems to be shifting in favor of India, but it is still too early to make a judgment on whether this is a long term change, or just a hiccup.
If equity markets surprised us with their resilience in 2020, not just weathering a pandemic for the ages, but prospering in its midst, US equity markets, in particular, managed to find light even in the darkest news stories, and continued their rise through 2021. The year that was.
In this post, I will focus on corporate debt in 2023, keeping in mind that it was a year where the tradeoffs changed, as interest rates rose to pre-2008 levels, and putting at risk those firms that had borrowed to capacity, or even beyond, at low interest rates.
RiskPremiums : You cannot make informed financial decisions, without having measures of the price of risk in markets, and I report my estimates for these values for both debt and equity markets. I am not, and have no desire to be, a data service, and will not be updating until the start of 2023.
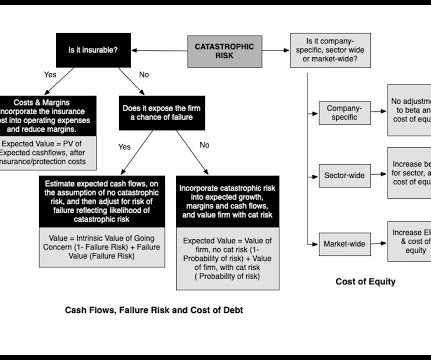
Minuses : As in the last approach, you still have to estimate a probability that a catastrophe will occur, and in addition, and there can be challenges in estimating the value of a business, if the company fails in the face of catastrophic risk. 4 & 5 Uninsurable Risk. Note that these higher discount rates apply in both scenarios.
In my last post , I noted that the US has extended its dominance of global equities in recent years, increasing its share of market capitalization from 42% in at the start of 2023 to 44% at the start of 2024 to 49% at the start of 2025.
After the 2008 market crisis, I resolved that I would be far more organized in my assessments and updating of equityriskpremiums, in the United States and abroad, as I looked at the damage that can be inflicted on intrinsic value by significant shifts in riskpremiums, i.e., my definition of a crisis.
Thus, as you peruse my historical data on implied equityriskpremiums or PE ratios for the S&P 500 over time, you may be tempted to compute averages and use them in your investment strategies, or use my industry averages for debt ratios and pricing multiples as the target for every company in the peer group, but you should hold back.
I will follow up by examining changes in corporate bond rates, across the default ratings spectrum, trying to get a measure of how the price of risk in bond markets changed during 2024. They made a mild comeback in 2023 and that recovery continued in 2024.
I first posted about AI in the context of valuing Nvidia , in June 2023, when there was still uncertainty about whether AI had legs. That is partly why, I have shed portions of my holdings in Nvidia, selling half my holdings in the summer of 2023 and another quarter in the summer of 2024.
The Debt Trade off As a prelude to examining the debt and equity tradeoff, it is best to first nail down what distinguishes the two sources of capital. To me, the key distinction between debt and equity lies in the nature of the claims that its holders have on cash flows from the business.
I aggregated the market capitalizations of all stocks at the end of 2023 and the end of 2024, and computed the percentage change. The results, broken down broadly by geography are in the table below: As you can see, the aggregate market cap globally was up 12.17%, but much of that was the result of a strong US equity market.
Thus, my estimates of equityriskpremiums, updated every month, are not designed to make big statements about markets but more to get inputs I need to value companies. of global GDP in 1995 to 3.96% in 2023 and the latter seeing its share dropping from 25.69% of global GDP in 1990 to 14.86%.
We organize all of the trending information in your field so you don't have to. Join 8,000+ users and stay up to date on the latest articles your peers are reading.
You know about us, now we want to get to know you!
Let's personalize your content
Let's get even more personalized
We recognize your account from another site in our network, please click 'Send Email' below to continue with verifying your account and setting a password.


Let's personalize your content