This site uses cookies to improve your experience. To help us insure we adhere to various privacy regulations, please select your country/region of residence. If you do not select a country, we will assume you are from the United States. Select your Cookie Settings or view our Privacy Policy and Terms of Use.
Cookie Settings
Cookies and similar technologies are used on this website for proper function of the website, for tracking performance analytics and for marketing purposes. We and some of our third-party providers may use cookie data for various purposes. Please review the cookie settings below and choose your preference.
Used for the proper function of the website
Used for monitoring website traffic and interactions
Cookie Settings
Cookies and similar technologies are used on this website for proper function of the website, for tracking performance analytics and for marketing purposes. We and some of our third-party providers may use cookie data for various purposes. Please review the cookie settings below and choose your preference.
Strictly Necessary: Used for the proper function of the website
Performance/Analytics: Used for monitoring website traffic and interactions
The market leader for CRM software is currently trading at around $133 per share, down more than 50% from its all-time-high of $300 per share, achieved in November 2021. . billion, an increase of 14% compared to Q3 in 2021. At the current level Salesforce has a P/E ratio of 100x and an EV/EBITDA ratio of 47x for 2022.
The market leader for CRM software is currently trading at around $133 per share, down more than 50% from its all-time-high of $300 per share, achieved in November 2021. . billion, an increase of 14% compared to Q3 in 2021. At the current level Salesforce has a P/E ratio of 100x and an EV/EBITDA ratio of 47x for 2022.
A useful tip is to check for consistency between the forecast margins and historical margins—EBITDA margin, EBIT margin, and Net Income margin. Hockey stick-like growth in your DCF projections may indicate these projections are not realistic.
The ratio used might be EV/EBITDA, EV/Sales, P/E or another, depending on the valuation performed and the type of business being valued. So another major assumption when adopting this method, is that the type of ratio chosen as the comparison point, such as P/E or EV/EBITDA should be similar across similar firms. .
The ratio used might be EV/EBITDA, EV/Sales, P/E or another, depending on the valuation performed and the type of business being valued. So another major assumption when adopting this method, is that the type of ratio chosen as the comparison point, such as P/E or EV/EBITDA should be similar across similar firms. .
While expanding its portfolio in 2021 and 2022 with acquisitions like Brazil’s Hemmer condiment and sauce company and an 85% stake in Germany’s Just Spices GmbH, the company has also recently agreed to sell its Russian baby food business to Chernogolovka. Adjusted EBITDA decreased 5.8% billion in 2020. billion to USD 74.5
While expanding its portfolio in 2021 and 2022 with acquisitions like Brazil’s Hemmer condiment and sauce company and an 85% stake in Germany’s Just Spices GmbH, the company has also recently agreed to sell its Russian baby food business to Chernogolovka. Adjusted EBITDA decreased 5.8% billion in 2020. billion to USD 74.5
It sold 301,000 cars in 2021, an 11% improvement compared to the prior year. In the fo rmer, we compared Porsche with peers such as BMW, Mercedes-Benz, Ferrari and Ford using thethe EV/EBITDA and the EV/EBIT multiples. In terms of results Porsche had a very successful financial year. The company achieved sales of €33.1
The company also was able to increase its EBITDA by 6.5% with an overall EBITDA margin of 35.2%. After this shock to the price of the company’s shares, they recovered to €80 per share in November 2021, after which they went steadily downhill until they reached €46 per share in early October this year. in non-beer products.
The company also was able to increase its EBITDA by 6.5% with an overall EBITDA margin of 35.2%. After this shock to the price of the company’s shares, they recovered to €80 per share in November 2021, after which they went steadily downhill until they reached €46 per share in early October this year. in non-beer products.
billion with EBIT margin increasing to 16.6% ABB performed particularly well in the COVID years 2020-2021, almost doubling its share price during this period. The Trading Comparables analysis resulted in a valuation range of CHF 47 to 83 billion, by applying the observed trading multiples EV/EBITDA, EV/EBIT and P/E.
billion with EBIT margin increasing to 16.6% ABB performed particularly well in the COVID years 2020-2021, almost doubling its share price during this period. The Trading Comparables analysis resulted in a valuation range of CHF 47 to 83 billion, by applying the observed trading multiples EV/EBITDA, EV/EBIT and P/E.
billion in 2021. Despite a -21% performance in 2022 to date, Home Depot’s share price gained 64% over the past five years, with particularly good performance during the 2020-2021 COVID years. It achieved an all time high of $415 in December 2021 and is currently trading at $314 per share with a market cap of $319 billion.
billion in 2021. Despite a -21% performance in 2022 to date, Home Depot’s share price gained 64% over the past five years, with particularly good performance during the 2020-2021 COVID years. It achieved an all time high of $415 in December 2021 and is currently trading at $314 per share with a market cap of $319 billion.
billion and an EBITDA of USD 1.09 The easing of travel restrictions and vaccine distribution in 2021 prompted a recovery, with the stock achieving an all-time high of USD 188.14 billion by applying the observed trading multiples EV/Sales, EV/EBITDA, EV/EBIT and P/E. billion, up from last year’s USD 759 million.
2022 saw a robust cash and capital structure with a staggering USD 967 million adjusted EBITDA in Q4, up by 14% from the previous year. With the economic recovery in 2021 and a resurgence in energy demand, Oneok’s operations and financial performance improved, leading to a rebound in its share price. billion using a WACC of 10%.
Net profit in 2022 is lower than in 2021, mainly due to an increase in operating expenses and the fact that the company received $860 million for divestments in 2021. . The Trading Comparables analysis resulted in a valuation range of $83 billion to $118 billion, by applying the observed trading multiples EV/EBITDA, EV/EBIT and P/E.
Net profit in 2022 is lower than in 2021, mainly due to an increase in operating expenses and the fact that the company received $860 million for divestments in 2021. . The Trading Comparables analysis resulted in a valuation range of $83 billion to $118 billion, by applying the observed trading multiples EV/EBITDA, EV/EBIT and P/E.
After following the rest of the market down during the early Covid-19 period, the share price steadily increased, achieving an all time high of $250 per share in July 2021. The Trading Comparables analysis resulted in a valuation range of $257 billion to $296 billion by applying the observed trading multiples EV/EBITDA, EV/EBIT and P/E.
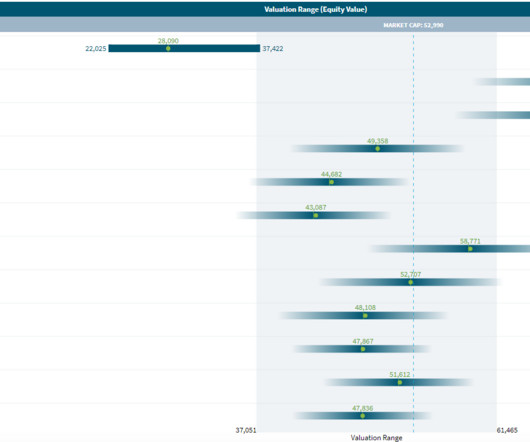
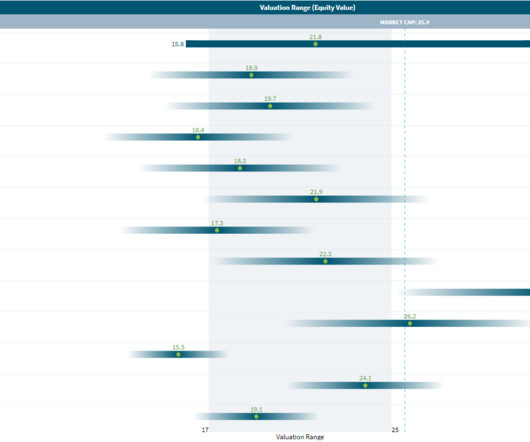
As a result, the share price tanked to PLN 168 ($35) in May 2021 and slipped further in 2022 to its current level or around PLN 120 ($25). . billion ($430 million) in 2020 after the release of Cyberpunk 2077, but in the following year, 2021, revenue dropped to PLN 890 million ($180 million). Recent Financial Performance. billion ($2.2
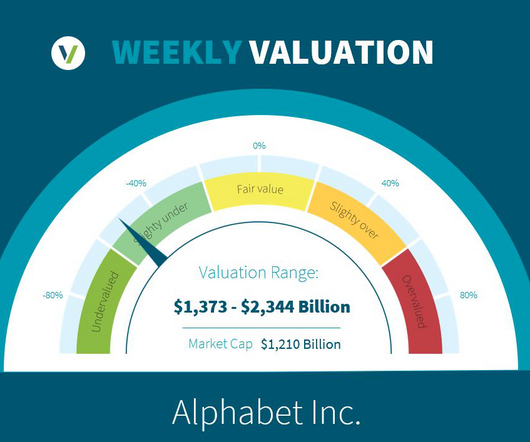
Recent Financial Performance Three weeks ago the company released its 2022 annual report, which showed strong revenue figures – growing by 10% to $283 billion compared to 2021. Despite this revenue growth, Alphabet was unable to maintain its healthy net profit margin, as net profit fell by around 5% to $75 billion.
Stock Market Implications Meta Platforms’ stock has been recovering steadily, now just 20% below its September 2021 peak. The Trading Comparables analysis resulted in a valuation range of USD 503 billion to USD 812 billion by applying the observed trading multiples EV/Sales, EV/EBITDA, EV/EBIT and P/E.
However, sales growth slowed to 16% in 2021 and is expected to be -1% in 2022, contributing to a sharp decline in the share price to USD 25 (HKD 195) in October 2022. billion to HKD 3,905 (USD 501) billion, by applying the observed trading multiples EV/EBITDA, EV/EBIT and P/E. billion to HKD 3,905 (USD 501) billion.
billion in 2021. We came up with this valuation range by using the observed trading multiples EV/EBITDA, EV/EBIT and P/E of peers such as Nike and Puma. . Two weeks ago the firm announced that it terminated its contract with the US rapper Ye (formerly known as Kanye West) due to his antisemitic statements. billion and €26.2
Two weeks ago TotalEnergies announced its net income for the third quarter of 2022 which increased by 43% compared to 2021 and amounted to €6.6 Our Trading Comparables analysis produced a valuation range of €178 billion to €222 billion, by applying the observed trading multiples EV/EBITDA, EV/EBIT, P/E and P/B.
However, sales growth slowed to 16% in 2021 and is expected to be -1% in 2022, contributing to a sharp decline in the share price to USD 25 (HKD 195) in October 2022. billion to HKD 3,905 (USD 501) billion, by applying the observed trading multiples EV/EBITDA, EV/EBIT and P/E. billion to HKD 3,905 (USD 501) billion.
However, sales growth slowed to 16% in 2021 and is expected to be -1% in 2022, contributing to a sharp decline in the share price to USD 25 (HKD 195) in October 2022. billion to HKD 3,905 (USD 501) billion, by applying the observed trading multiples EV/EBITDA, EV/EBIT and P/E. billion to HKD 3,905 (USD 501) billion.
Two weeks ago TotalEnergies announced its net income for the third quarter of 2022 which increased by 43% compared to 2021 and amounted to €6.6 Our Trading Comparables analysis produced a valuation range of €178 billion to €222 billion, by applying the observed trading multiples EV/EBITDA, EV/EBIT, P/E and P/B.
billion in 2021. We came up with this valuation range by using the observed trading multiples EV/EBITDA, EV/EBIT and P/E of peers such as Nike and Puma. . Two weeks ago the firm announced that it terminated its contract with the US rapper Ye (formerly known as Kanye West) due to his antisemitic statements. billion and €26.2
Stock Market Implications In the recent past, most notably in 2020 and 2021, Netflix experienced considerable growth in the stock market. billion to USD 150 billion, by utilizing observed metrics such as EV/EBITDA, EV/EBIT, and P/E ratios. Due to the COVID-19 shutdowns in 2020, new subscriptions increased dramatically.
By the same token, it is impossible to use a pricing metric (PE or EV to EBITDA), without a sense of the cross sectional distribution of that metric at the time. For example, I have seen it asserted that a stock that trades at less than book value is cheap or that a stock that trades at more than twenty times EBITDA is expensive.
As the overall market recovered and digital payments replaced cash, Visa’s stock grew by almost 50% in July 2021 from the lows of March 2020. Additionally, the Trading Comparables analysis generated a v aluation range of USD 220 billion to USD 290 billion, by utilizing observed metrics such as EV/EBITDA, EV/EBIT, and P/E ratios.
EBIT & EBITDA multiple s 5. Working capital needs Thus, I compute pricing multiples based on revenues (EV to Sales, Price to Sales), earnings (PE, PEG), book value (PBV, EV to Invested Capital) or cash flow proxies (EV to EBITDA). Revenue Multiples 4. Long term Reinvestment (Cap Ex & Acquisitons) 4.
The Transaction emerged through continued dialogue with MacKellar over the past two years, following NACG's entry into Australia through the acquisition of DGI Trading Pty Limited in 2021. The Transaction provides diversification with no single end market contributing more than approximately a third of adjusted EBIT.
For tax years 2021-2025, many public and private student loan discharges are excluded from gross income. Second, the limitation on business net interest deduction is reduced to 30% of earnings before interest and taxes (EBIT) instead of earnings before interest, taxes, depreciation, and amortization (EBITDA). What’s new? •
A good example is the 2020 – 2021 period, when SPAC activity went vertical, and plenty of renewable energy companies used SPACs to go public. If you look at the presentations and valuations below, you will still see standard valuation multiples like TEV / Revenue, TEV / EBITDA, and P / E.
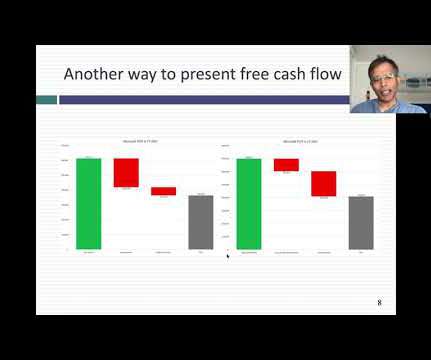
In the last two decades, I have seen free cash flow measures stretched to cover adjusted EBITDA, where stock-based compensation is added back to EBITDA, and with WeWork, to community-adjusted EBITDA, where almost all expenses get added back to get to the adjusted value.
The company’s share price was $45 at the beginning of 2018 and has since surged by over 100% to reach an all-time high of $102 by the end of 2021. The Trading Comparables analysis resulted in a valuation range of $174 billion to $391 billion, by applying the observed trading multiples EV/EBITDA, EV/EBIT and P/E.
The company’s share price was $45 at the beginning of 2018 and has since surged by over 100% to reach an all-time high of $102 by the end of 2021. The Trading Comparables analysis resulted in a valuation range of $174 billion to $391 billion, by applying the observed trading multiples EV/EBITDA, EV/EBIT and P/E.
We organize all of the trending information in your field so you don't have to. Join 8,000+ users and stay up to date on the latest articles your peers are reading.
You know about us, now we want to get to know you!
Let's personalize your content
Let's get even more personalized
We recognize your account from another site in our network, please click 'Send Email' below to continue with verifying your account and setting a password.


Let's personalize your content